Week 6: Electronic input devices
Background
So, today, I will be doing three things
- Make a capacitive sensor to measure a physical quantity with your
microcontroller.
- I will discuss my three versions of this
- Select another sensor of your choosing (temperature, microphone, etc.).
- I will specifically be using a thermosister.
- Calibrate each sensor and visualize data in the form of a table or graph.
Discuss the relationship between the signals recorded by your microcontroller
and the physical quantities that you're measuring.
- I will be discussing how I did this in each section.
Thermistor
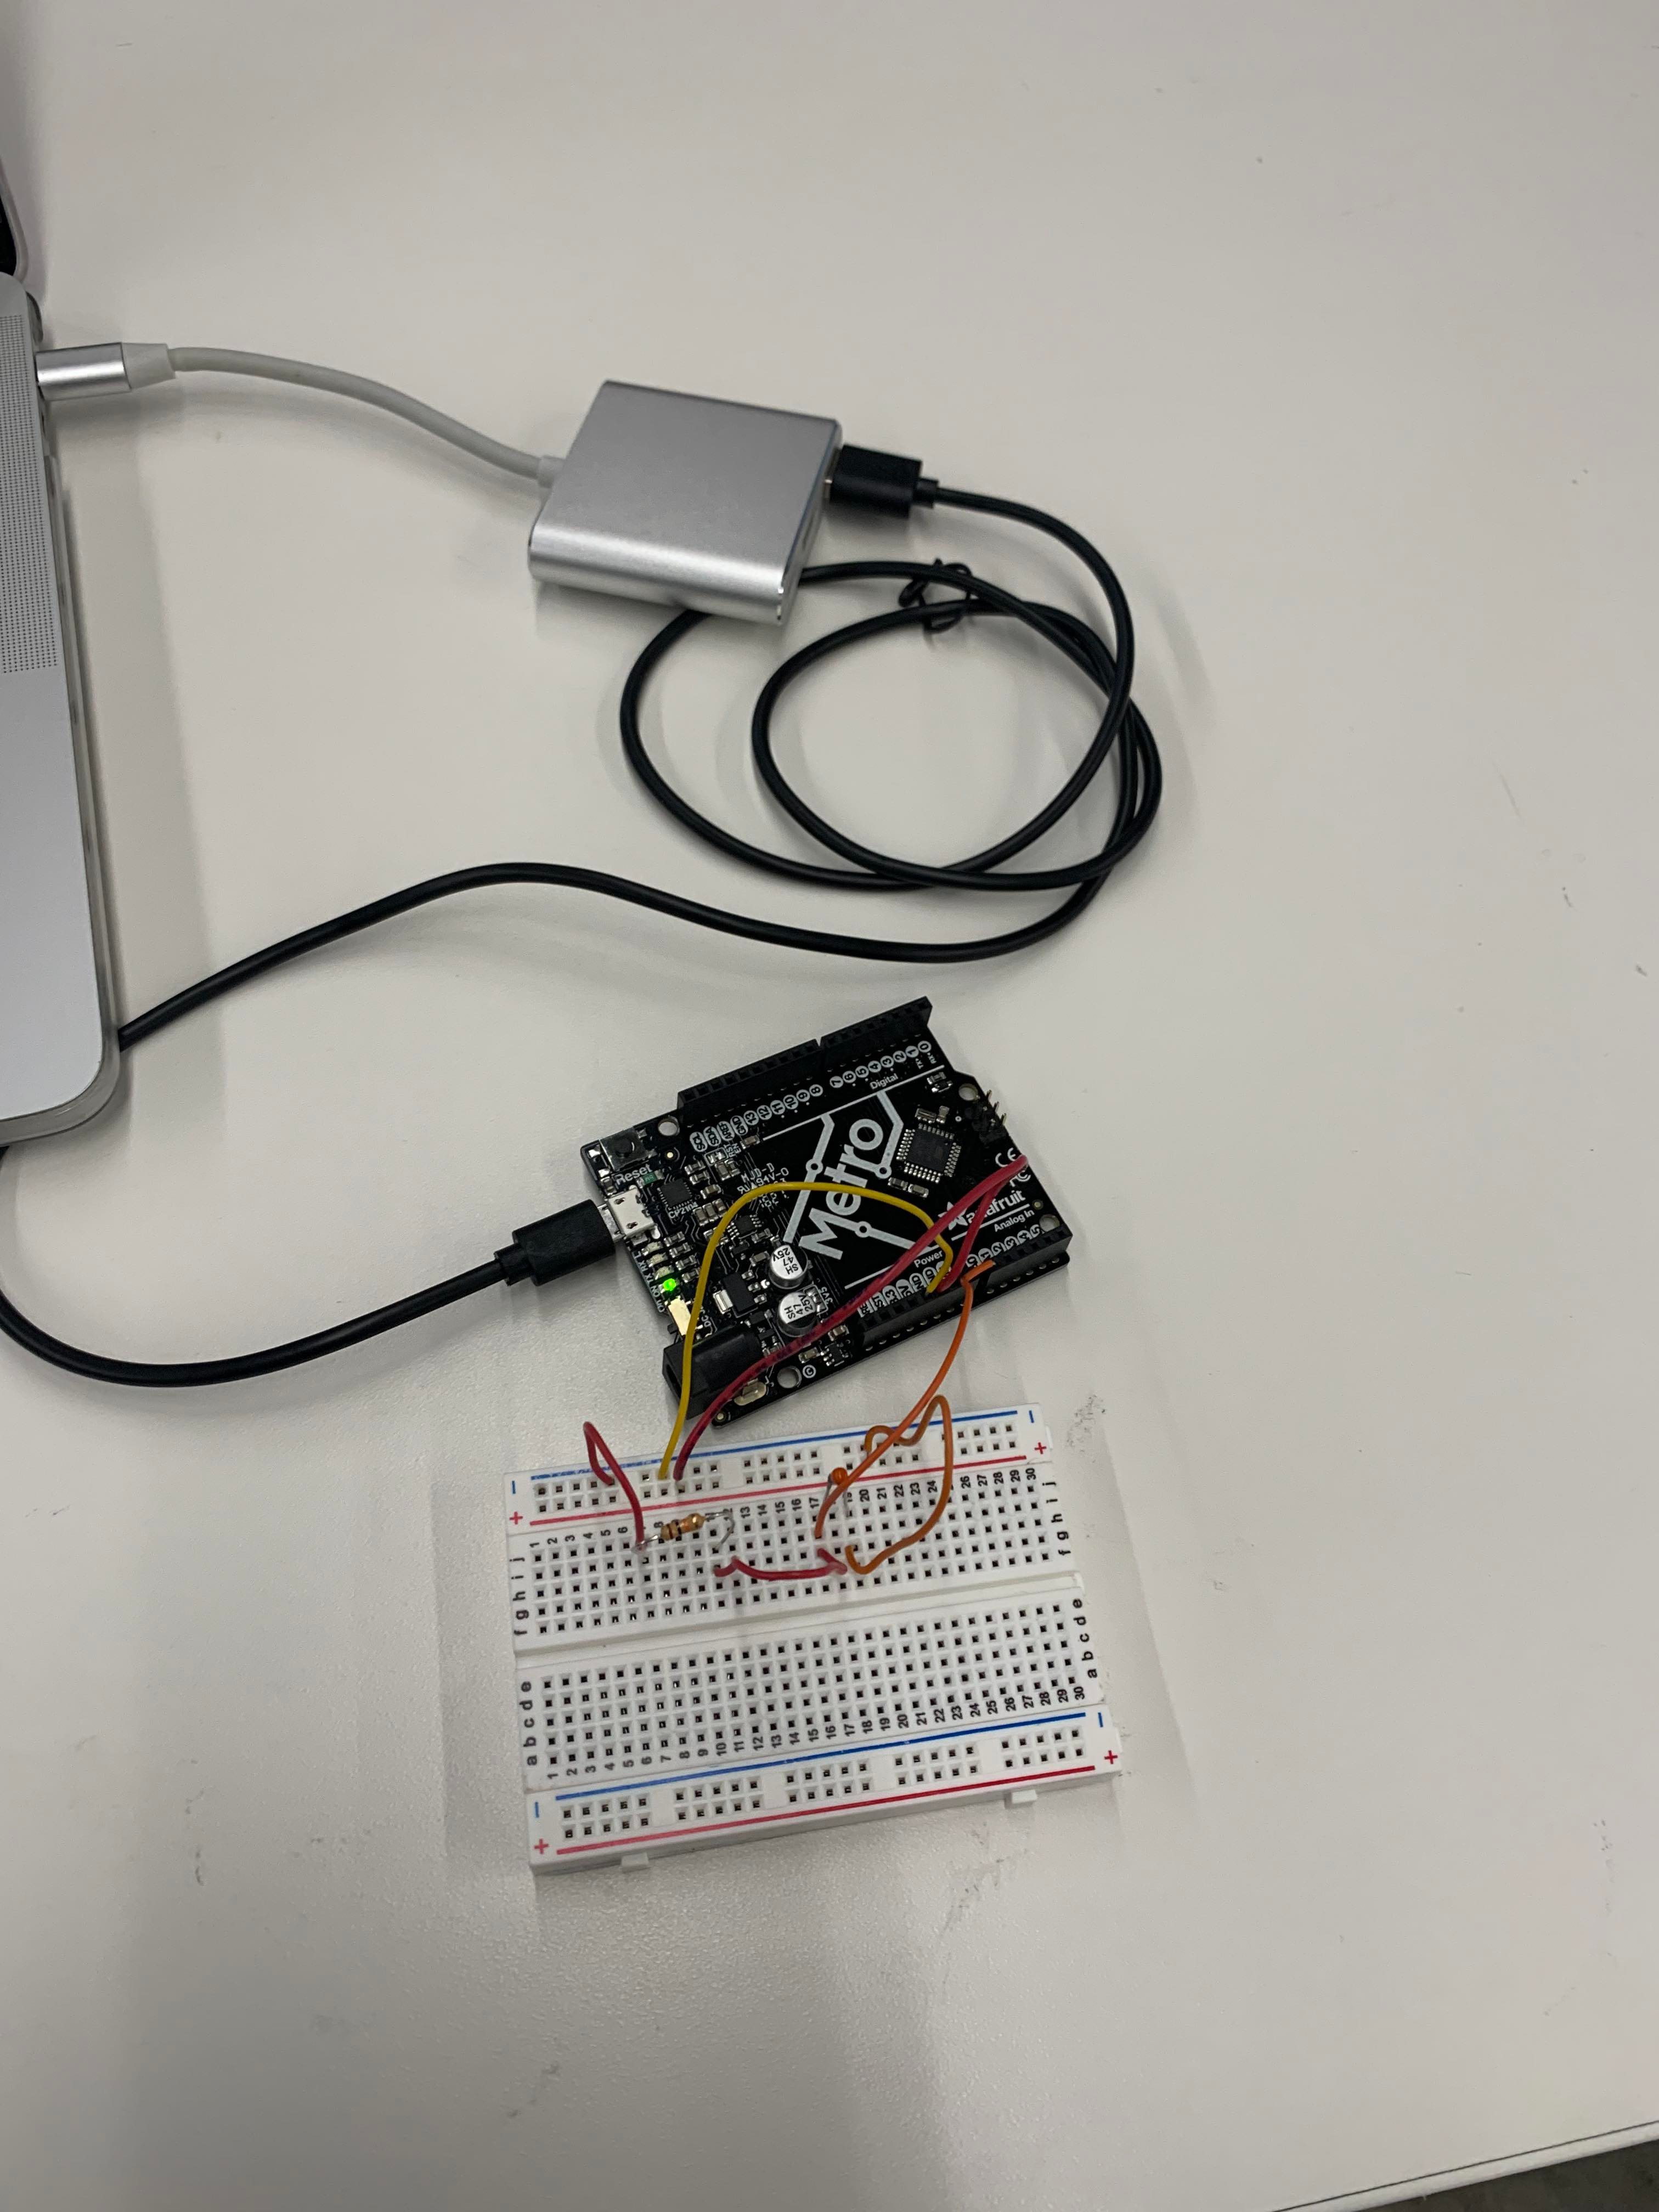
My potential final project is related to composting toilets. Hence, I thought it would be valuable to look into making a thermosister, which could be used in examples like measuring the temperature of the compost that comes out of the composting toilet. To do this, I looked at the Arduino create website as reference (https://create.arduino.cc/projecthub/Marcazzan_M/how-easy-is-it-to-use-a-thermistor-e39321 (opens in a new tab)). I then recreated the circuit displayed in the pictorial.
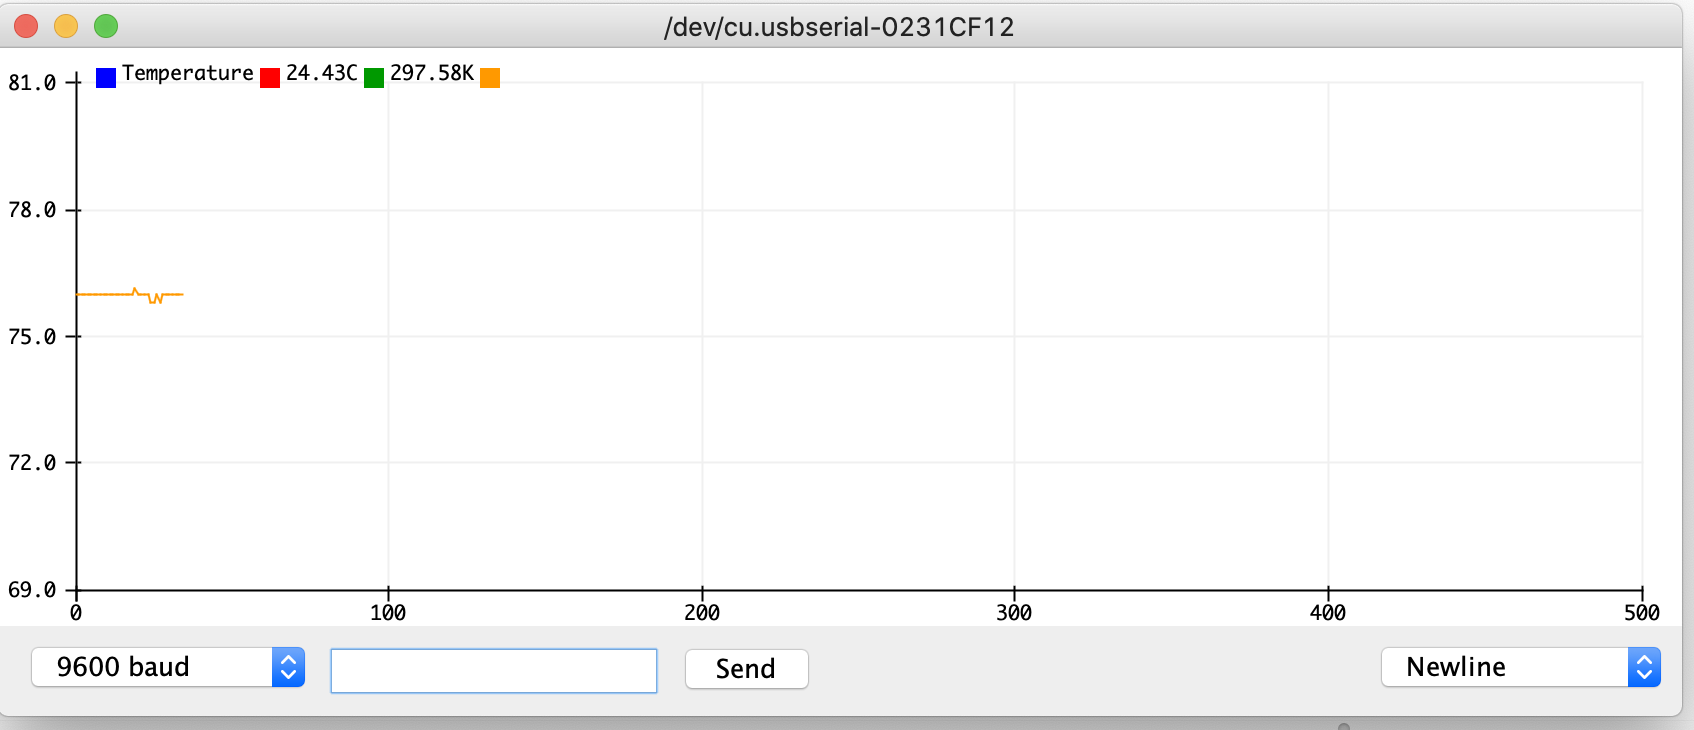
I then looked at the sample code corresponding to the thermosister and played around with it. Notably, the top display types in the degrees for Kelvin and Celsius. However, it only prints the graph for the Farenheit and I want it to also display the value for the Farenheit in the Serial plotter itself. As you can see based on the image below, there is no value next to the orange rectangle. Instead, the corresponding value is on the plotter. However, I wanted the farenheit value to be both in the graph and also have the value typed out.
I thus played around with the code in attempts to have the farenheit temperature be displayed in the graph but also have the temperature be explicity written out on the serial plotter. This turned out to be a larger challenge than originally thought. I tried putting print commands in various locations, all to no luck. I also checked the serial monitor constantly to ensure that values were being outputted onto the serial monitor.
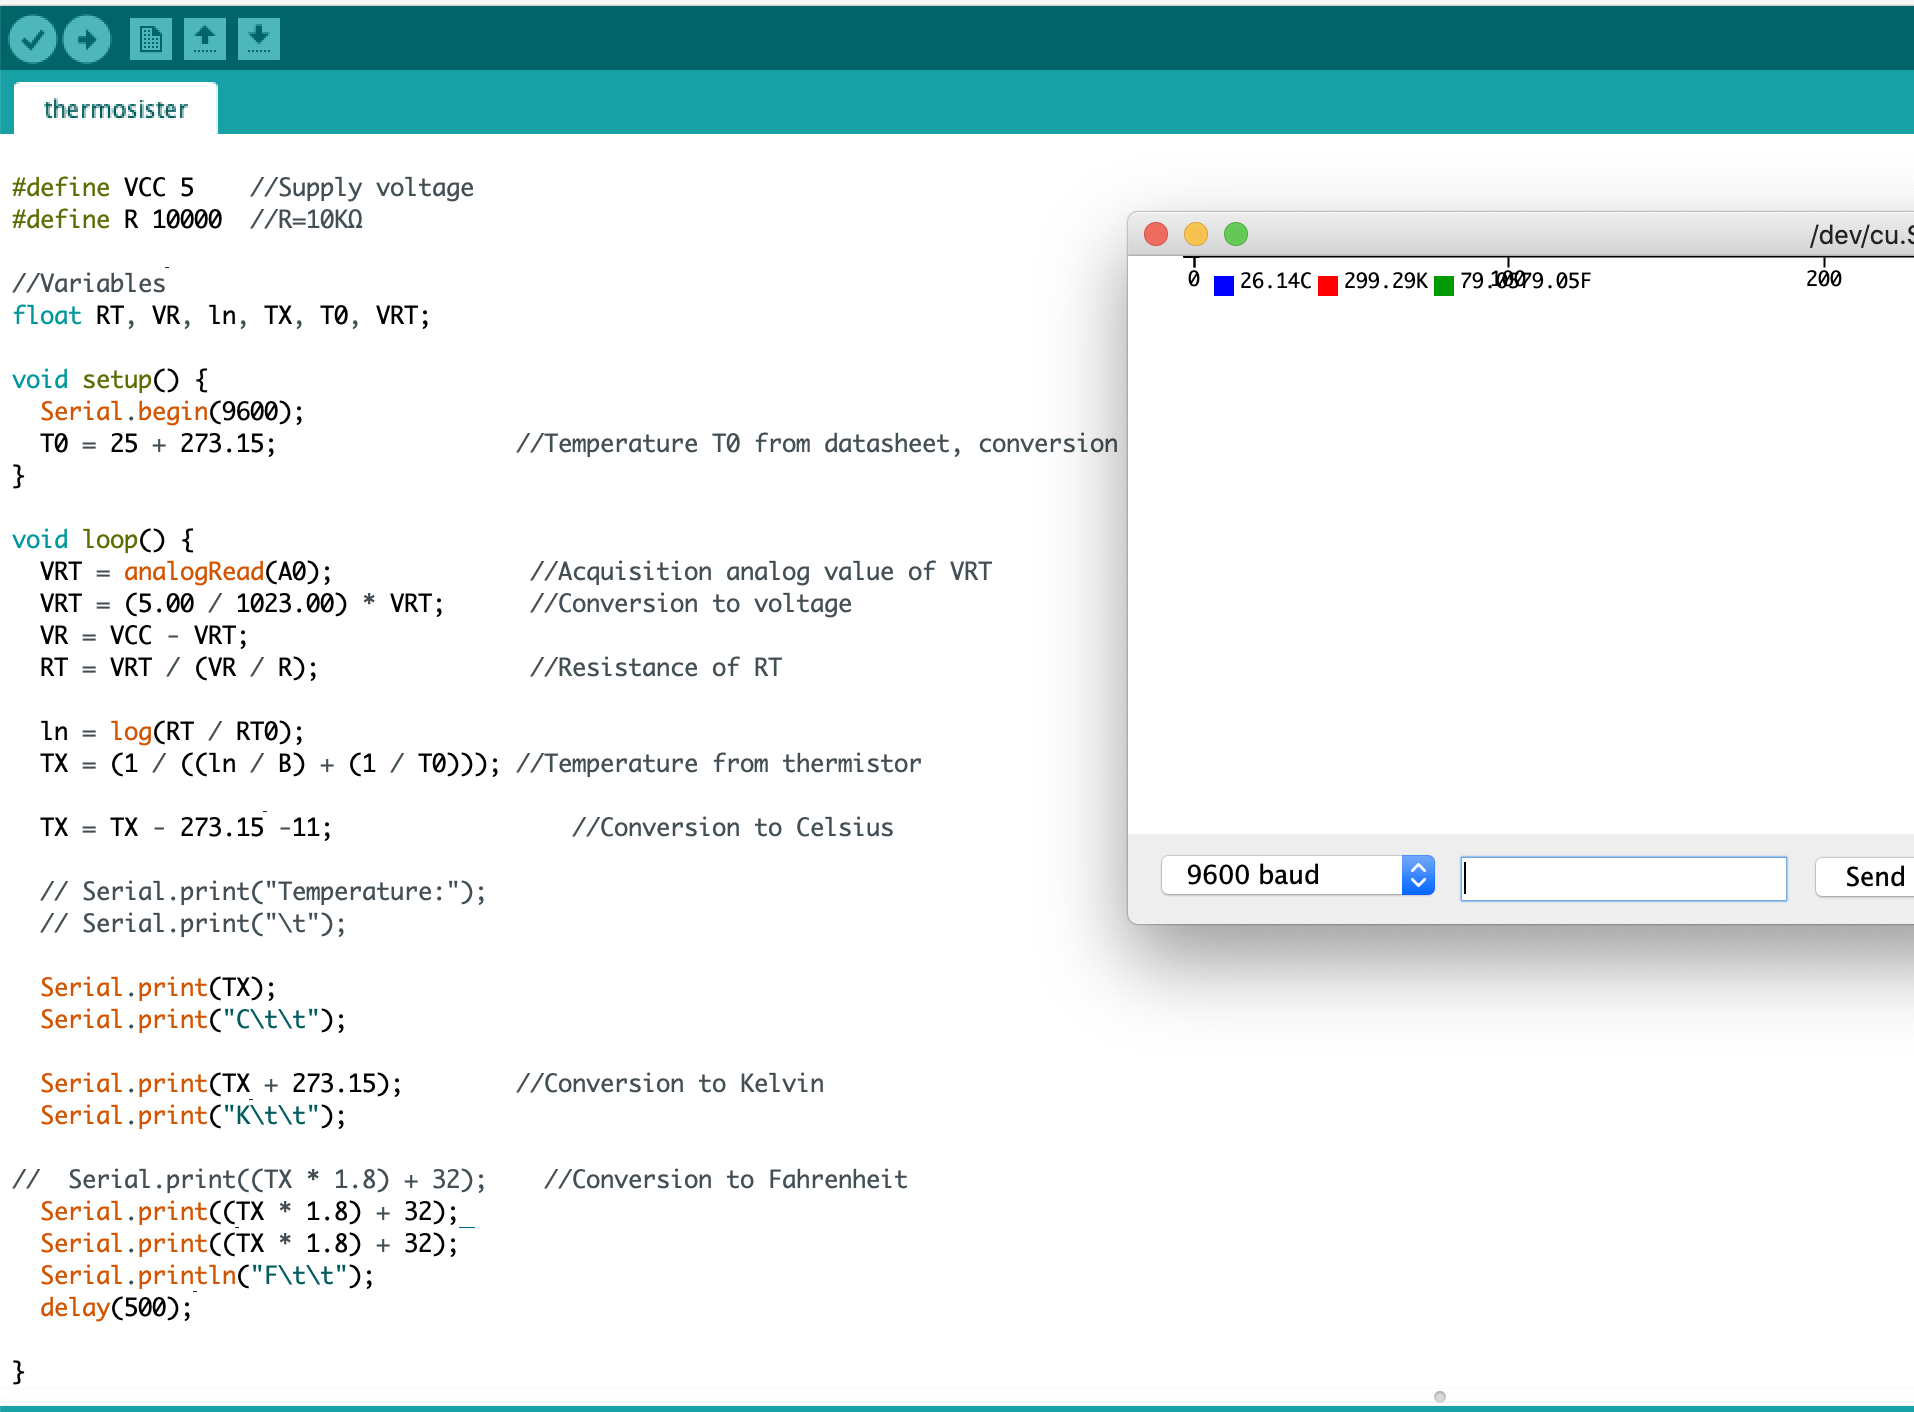
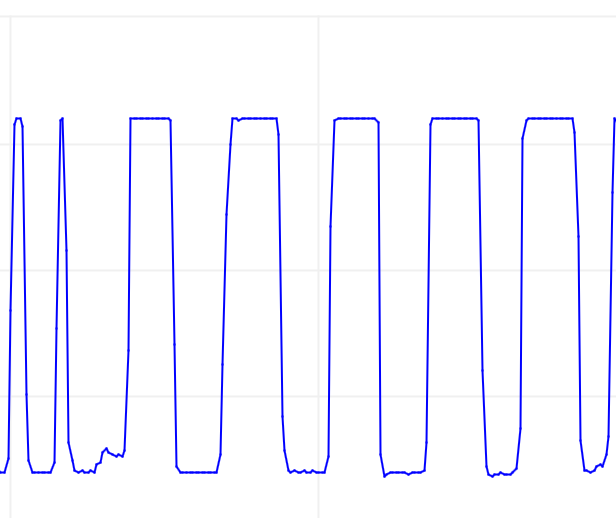
For instance, this is an example of something that didn't work: You can see that the numbers overlap with each other
Here's also something that didn't work:
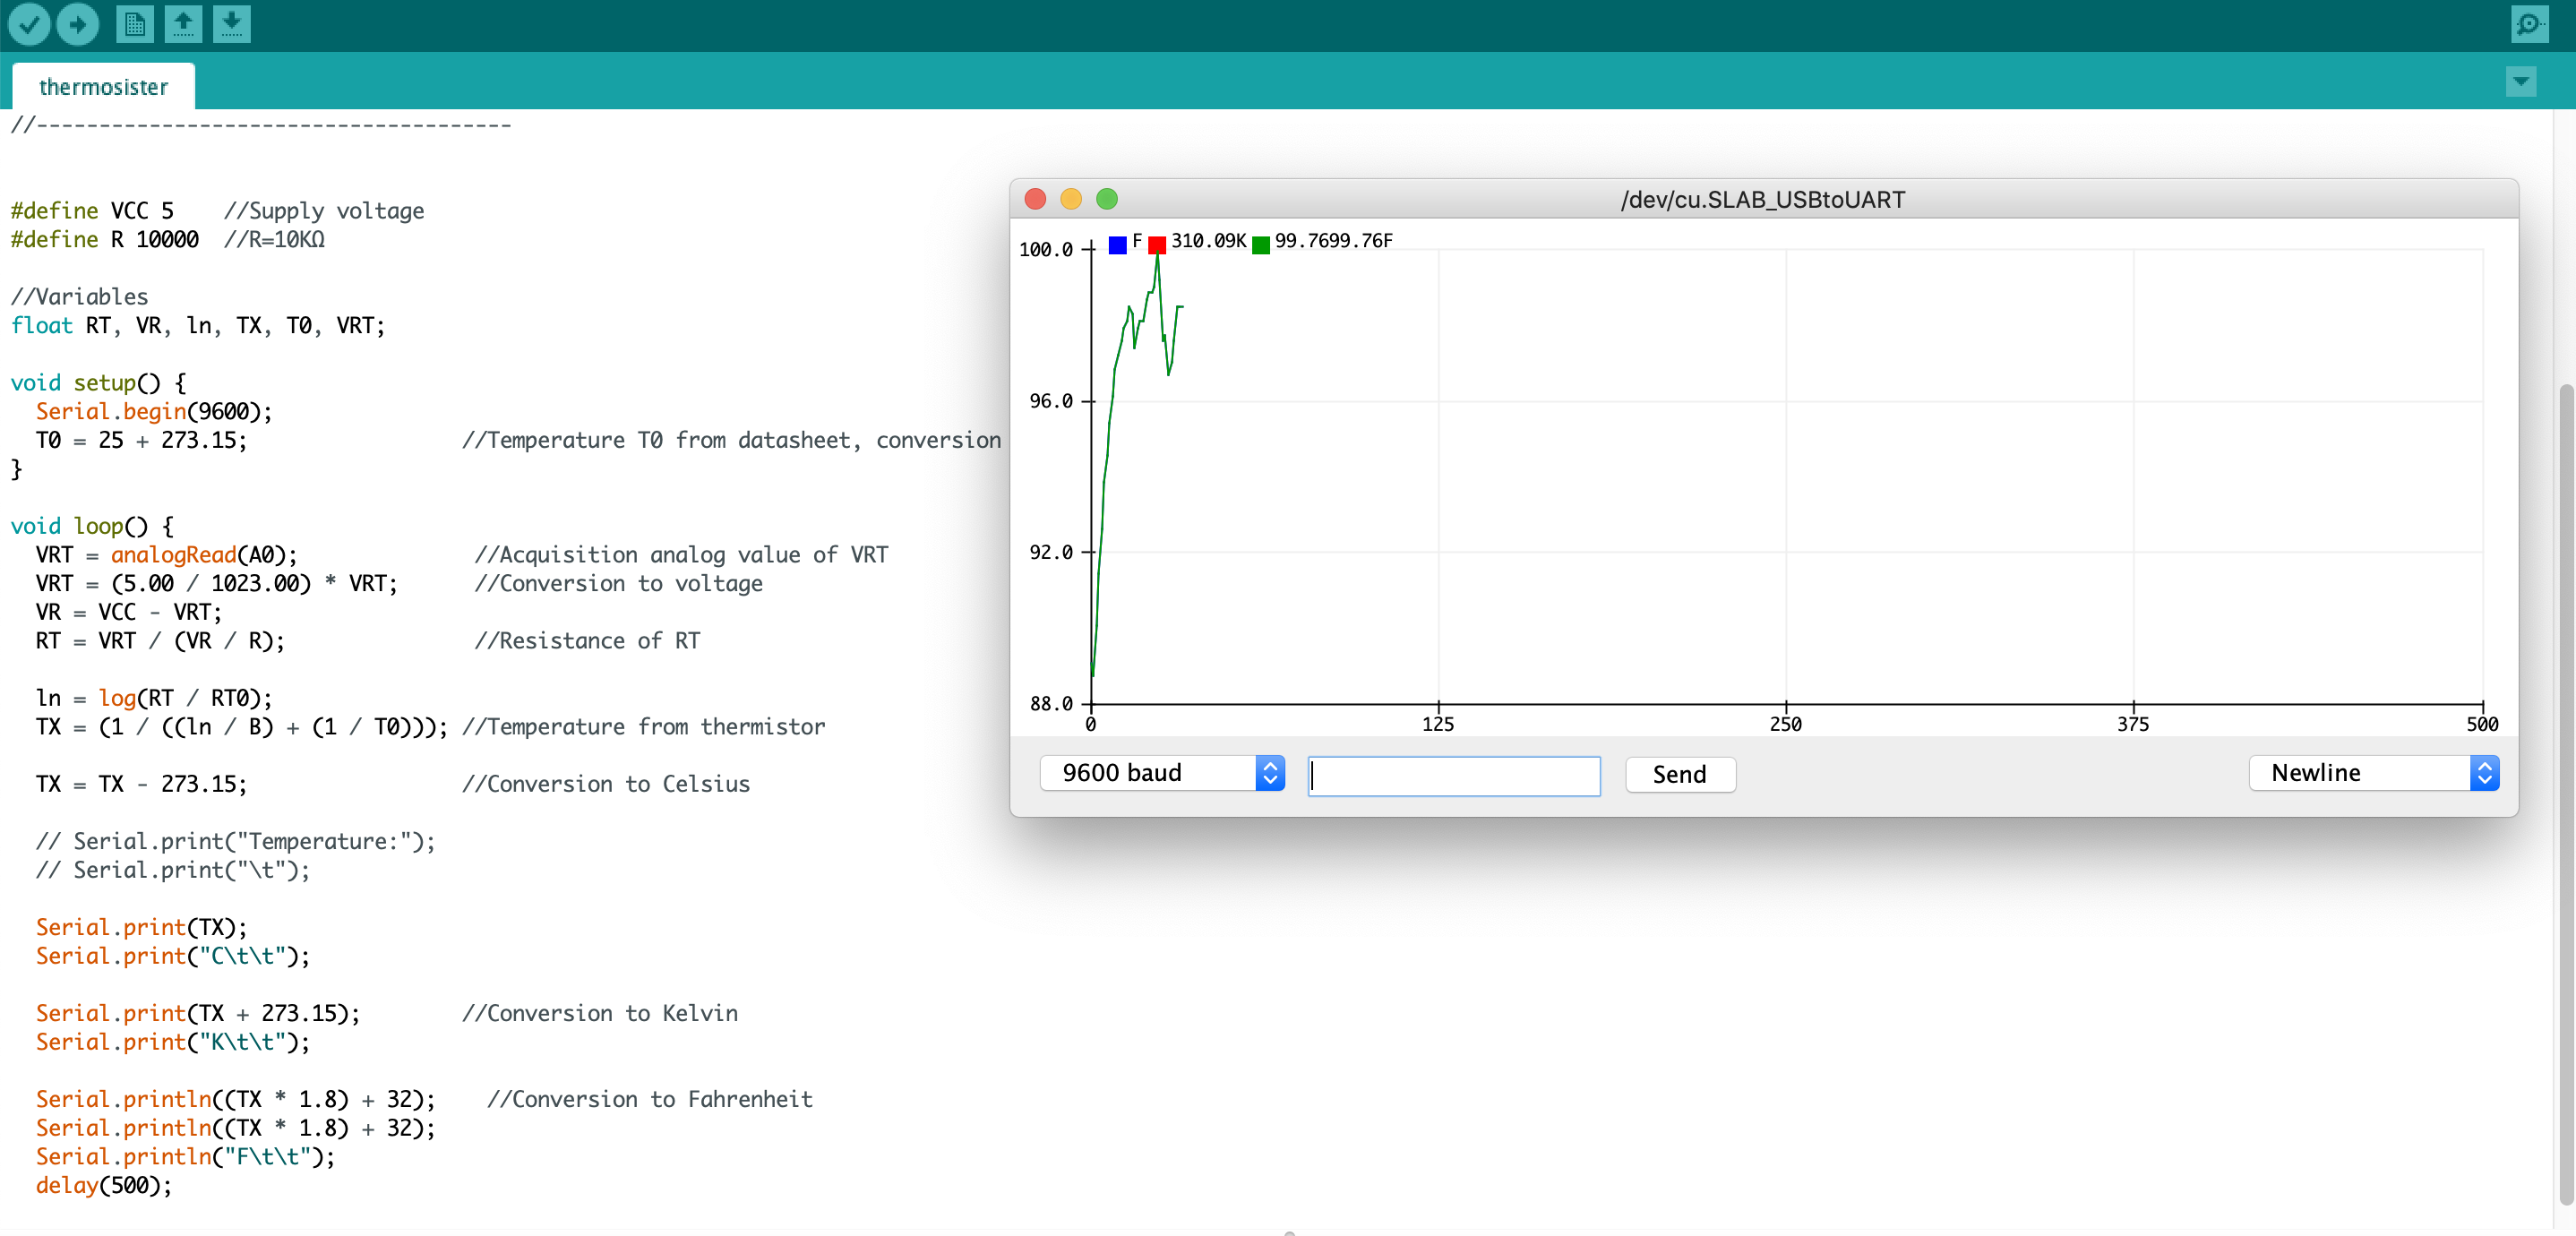
Ultimately, I was able to play around and get the display on the serial plotter I wanted: aka the numerical writing of the temperature in C, F, K, as well as the plotting of the F.
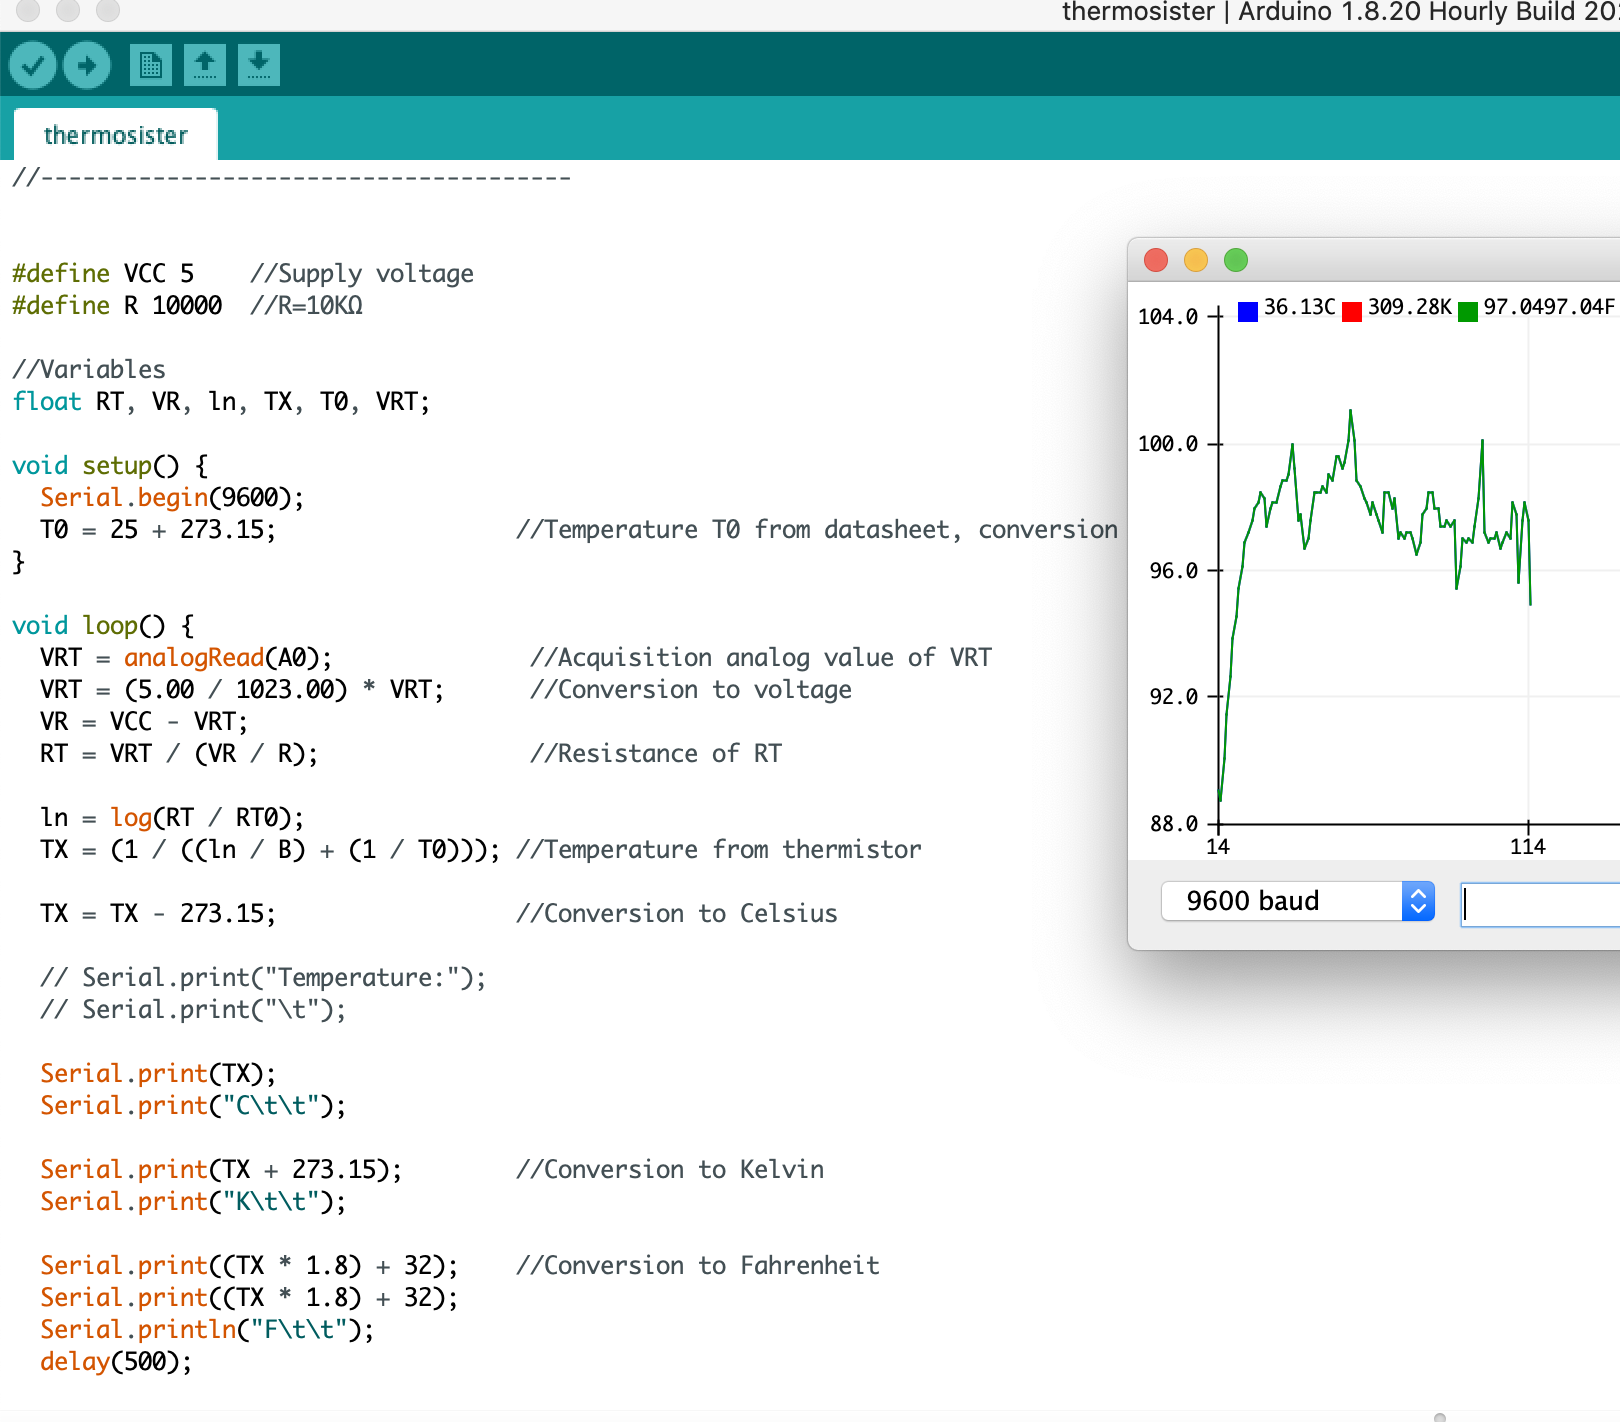
Ultimately, this was the code that I used at the end. I was able to get the Farenheit temperature to be both displayed on the graph and for the value to be typed out alongside the other numbers as well.
//Thermometer with thermistor

/*thermistor parameters:
 * RTI: 10 000 Ω
 * B: 3977 K +- 0.75%
 * TI:  25 C
 * +- 5%
 */

//These values are in the datasheet
#define RTI 10000   // Ω
#define B 3977      // K
//--------------------------------------


#define VCC 3.3    //Supply voltage
#define R 10000  //R=10KΩ

//Variables
float RT, VR, ln, TE, TI, VRT;

void setup() {
  Serial.begin(9600);
  TI = 25 + 273.15;                 //Temperature TI from datasheet, conversion from Celsius to kelvin
}

void loop() {
  VRT = analogRead(A0);              //Acquisition analog value of VRT
  Serial.println(VRT);
  VRT = (3.30 / 1023.00) * VRT;      //Conversion to voltage
  VR = VCC - VRT;
  RT = VRT / (VR / R);               //Resistance of RT
  Serial.println("RT/RTI");
  Serial.println(RT/RTI);

  ln = log(RT / RTI);
  Serial.println("Ln");
  Serial.println(ln);
  TE = (1 / ((ln / B) + (1 / TI))); //Temperature from thermistor

  TE = TE - 273.15 -11;                 //Conversion to Celsius

  // Serial.print("Temperature:");
  // Serial.print("\t");


  Serial.print(TE);
  Serial.print("C\t\t");

  Serial.print(TE + 273.15);        //Conversion to Kelvin
  Serial.print("K\t\t");

  Serial.print((TE * 1.8) + 32);    //Conversion to Fahrenheit
  Serial.print((TE * 1.8) + 32);
  Serial.println("F\t\t");


  delay(500);

 // if TE > 26
  //else

}
Calibration of temperature
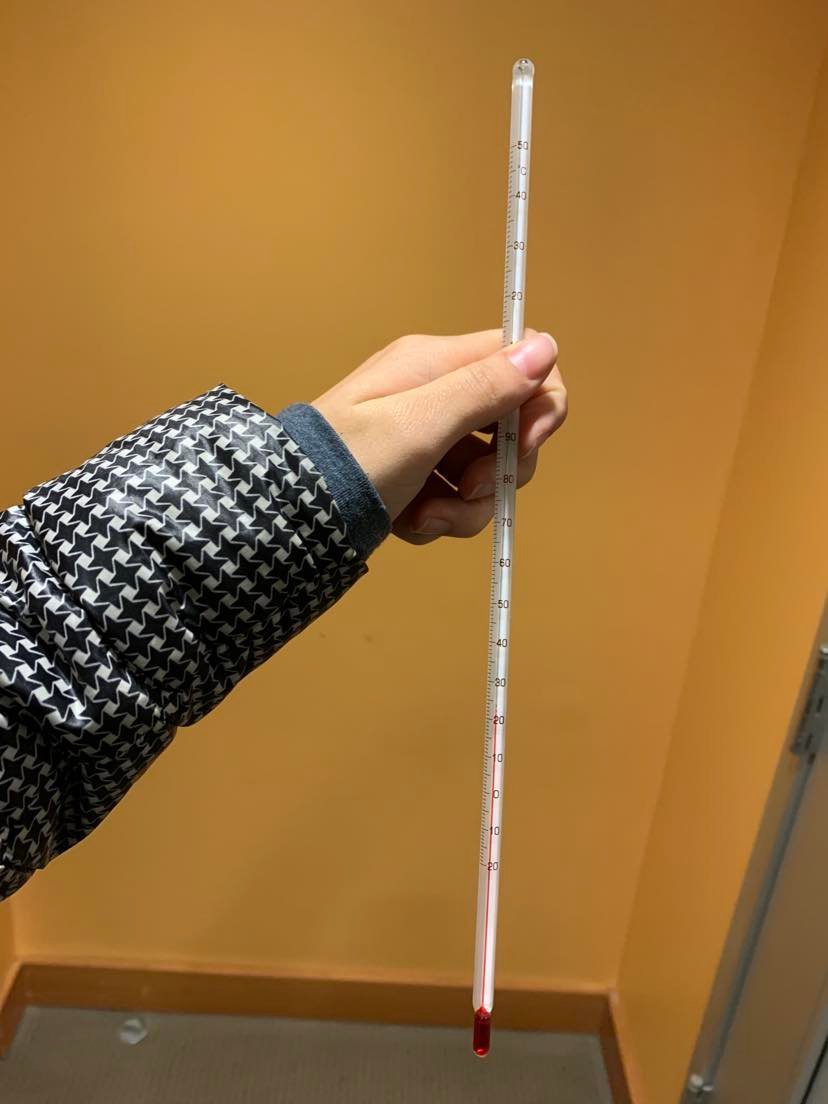
To calibrate it, I borrowed a thermometer from my lab and compared it to the temperature that I was getting on my serial monitor. It was about 11 degrees C. Hence, I accounted for that in my code by subtracting 11 degrees when calculating temperature.
Capacitative sensing
Sound
During lab on Thursday, Rob and I explored using capacitative sensing for sound. Essentially, we had put copper sheets in the metal bowl like so
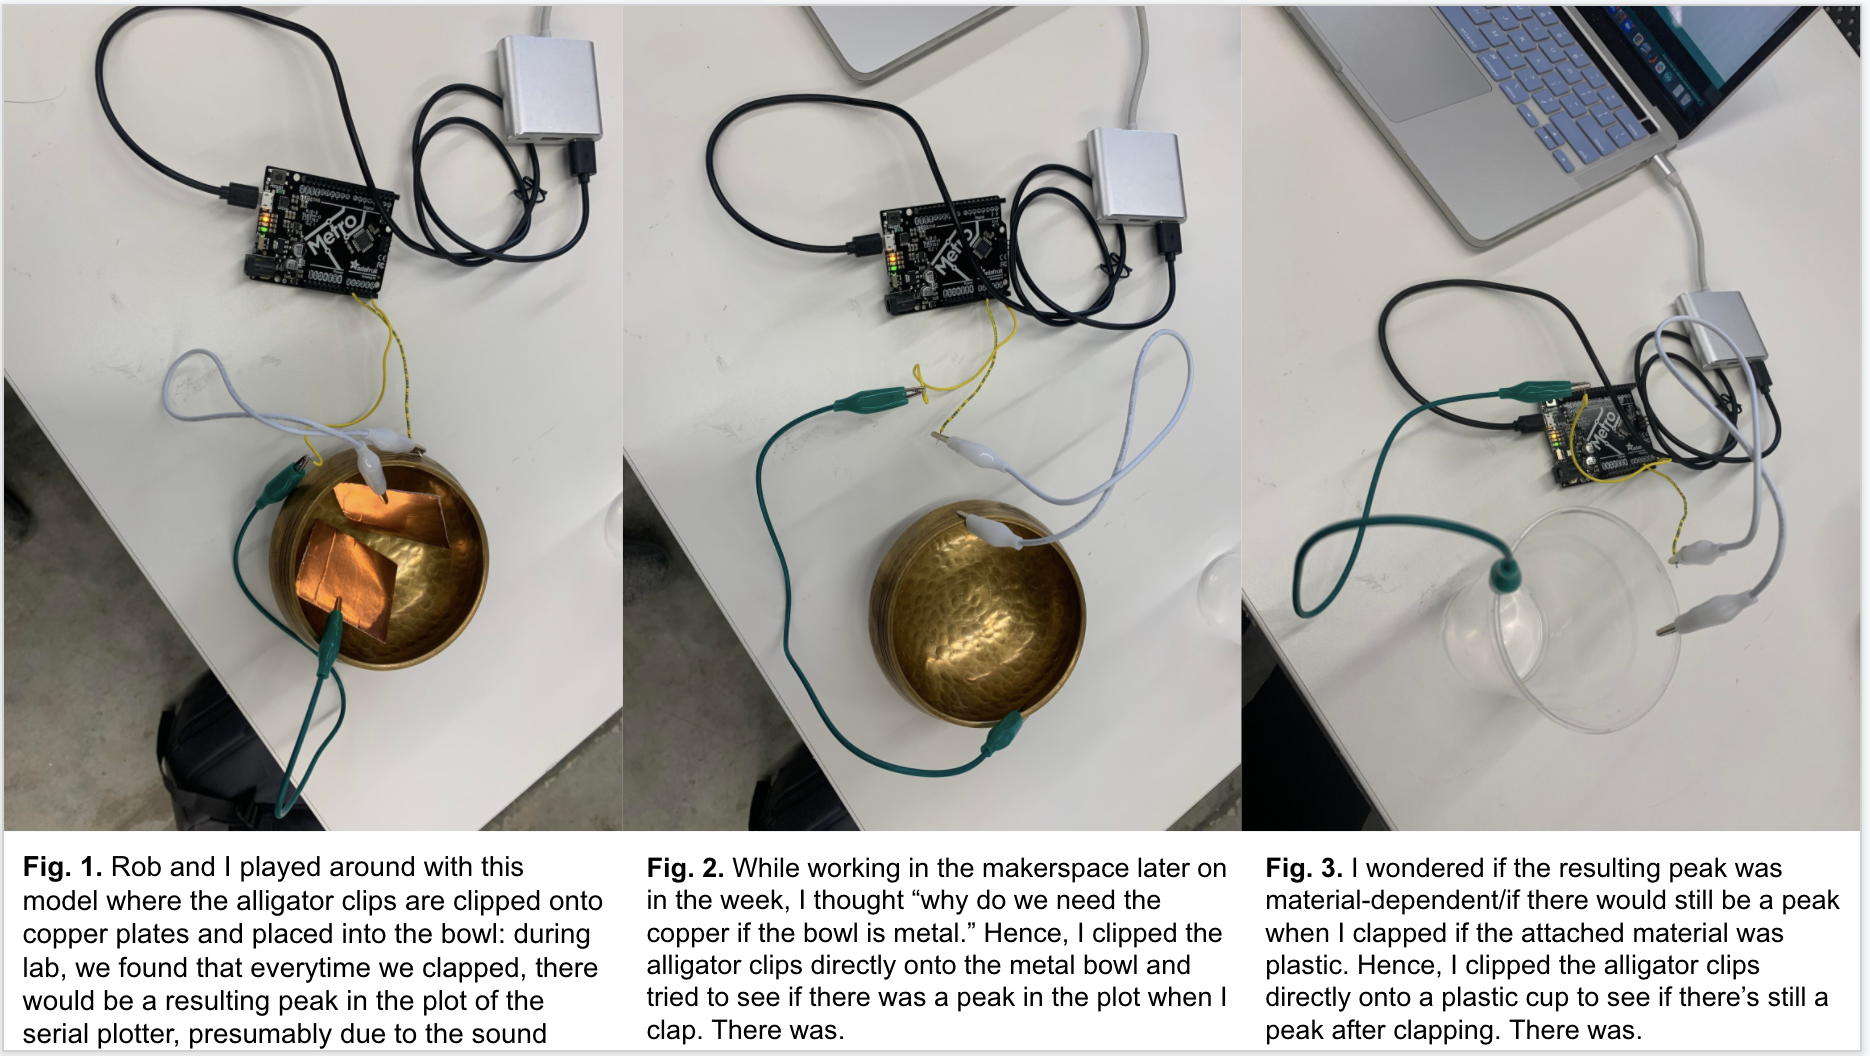
We noticed that there was a peak in the serial plotter every time we yelled into the bowl or clapped into our hands, presumably due to the vibration of the air and how that affects the capacitative sensing. However, this was a bit hard to quantiatively gauge. Thus, I decided to use capacitative sensing based on distance.
Distance
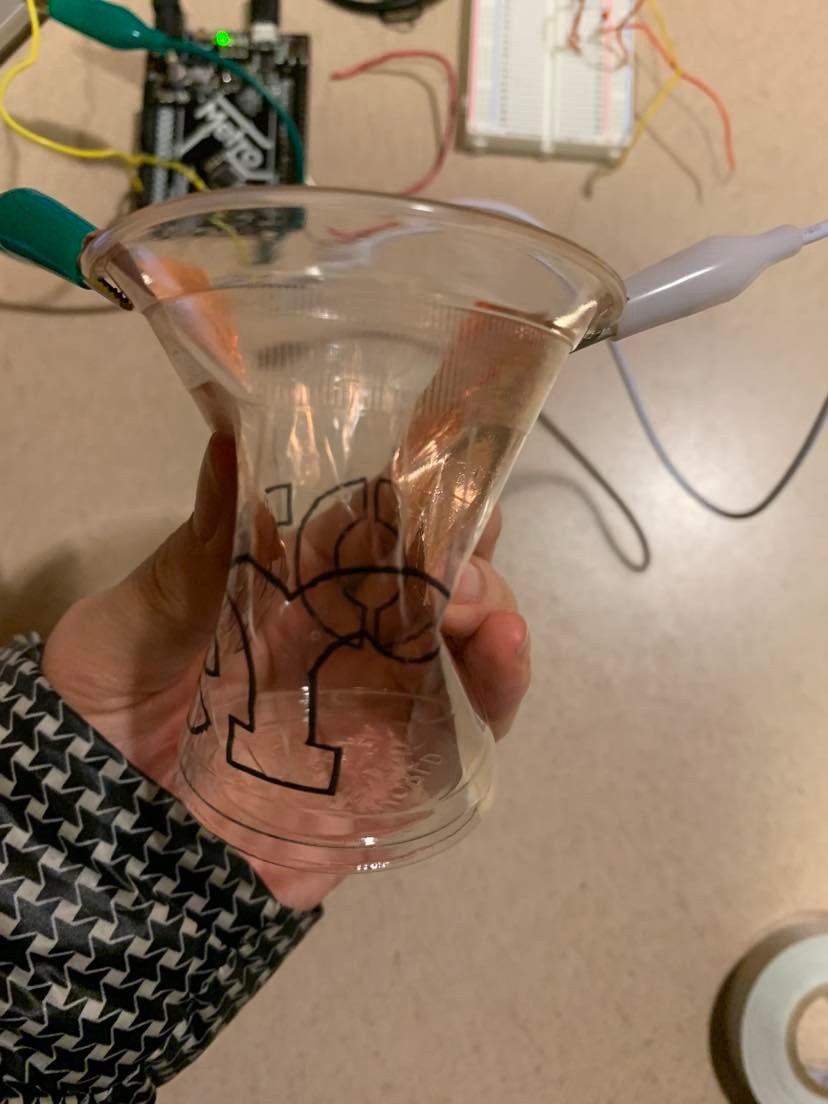
The first iteration was my "cup idea." Essentially, I squeezed the cup and sae peaks the more I squeezed the cups because the capacitative sensors were closer together. I used a ruler to measure the distance
Although this displayed results and visible peaks when I squeezed it, it was a little difficult to squeeze the cup at a specific distance. Moreover, the curvature of the cup made it a bit difficult to deter
Here's what the serial plotter output looks like:
My next iteration was the "eraser idea" Essentially, I moved the erasers along a ruler to see the total distance moved. I would then look at the serial plotter to see the corresponding graph. This was much more consistent than the cup, but I still wanted something more accurate/wasn't as subject to the angle of the eraser.
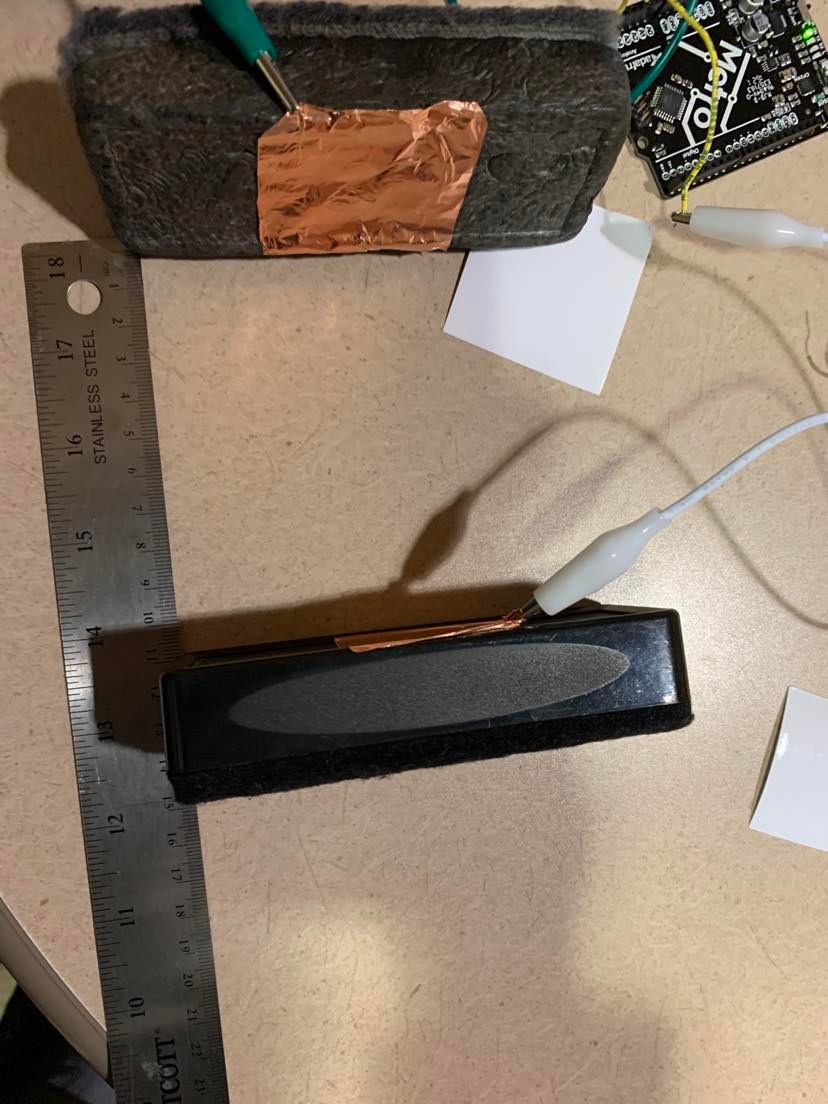
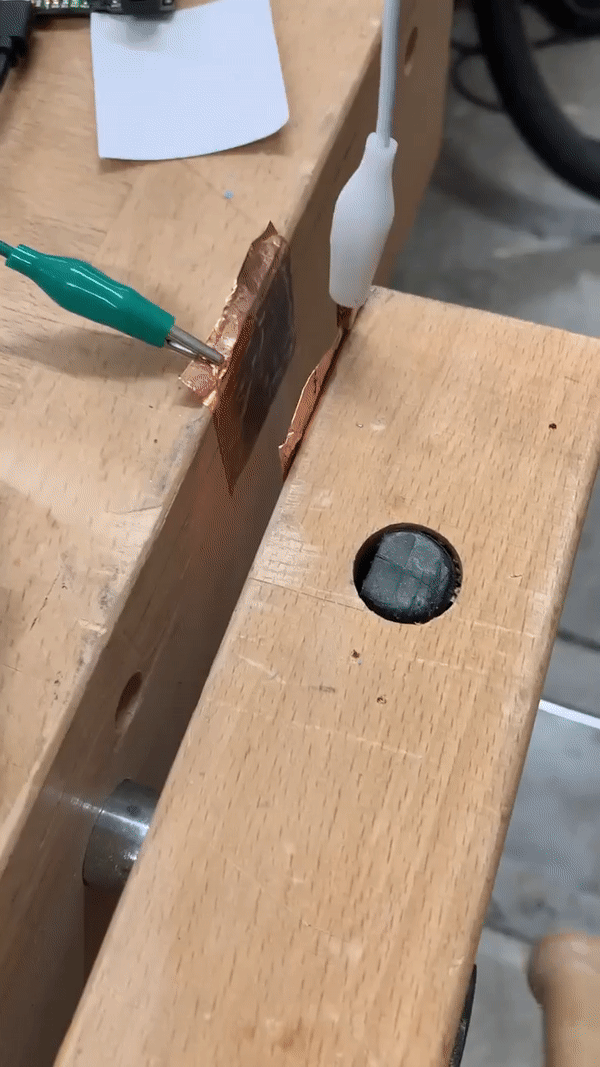
My little brother, who was on Spring break and with me at the time, suggested that I use the vice in the lab instead. That way, I have more control over the actual distance. As demonstrated in the video, I can crank it to get it a fixed position. Thus, I can directly crank it to the distance I want it to be.
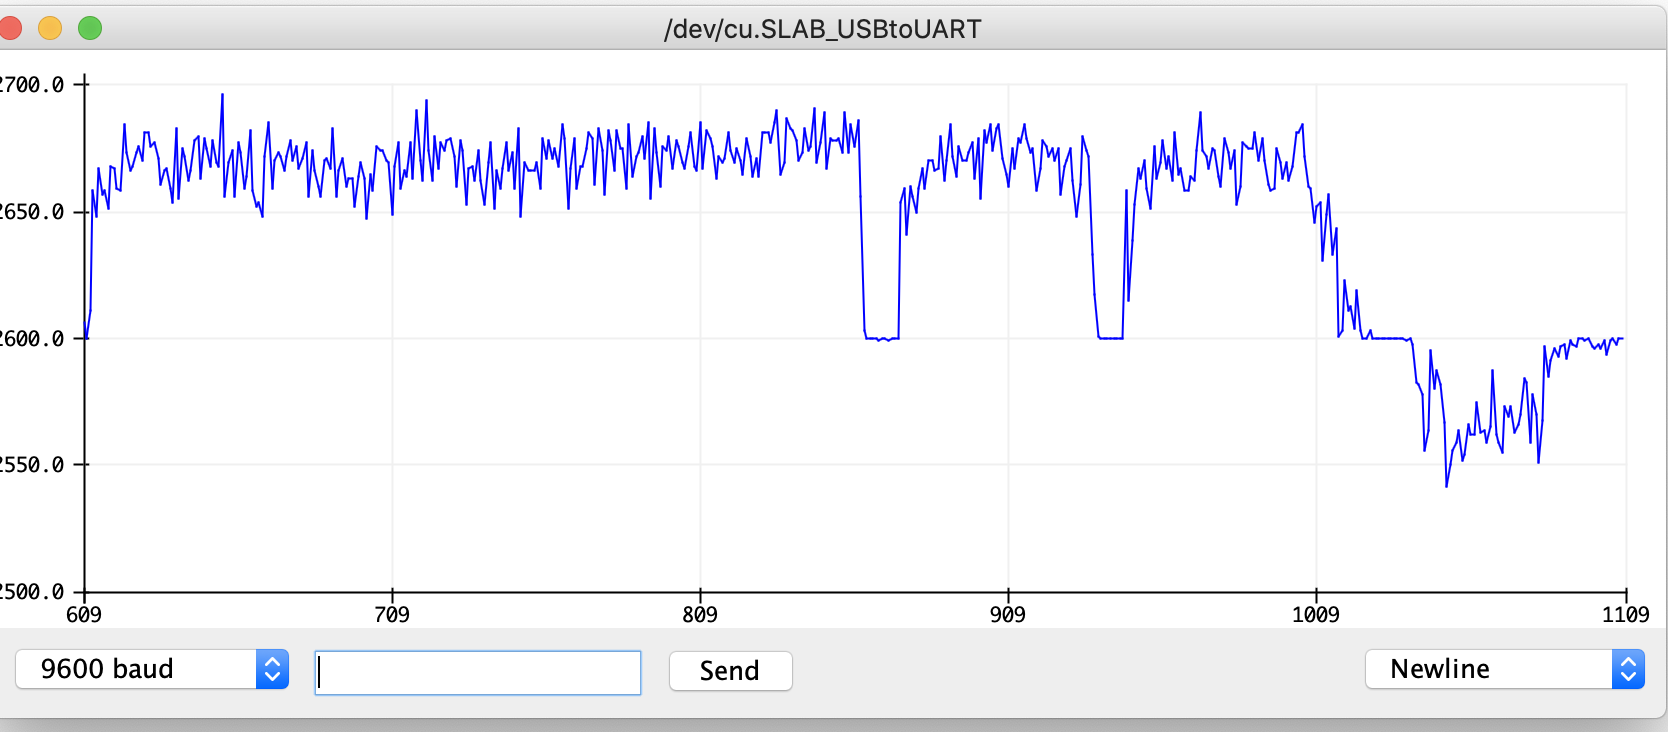
The peaks of this looked a lot more consistent. By going back and forth between the two same distances, I'm also able to get very stable peaks like so. Here's what the serial plotter output looks like:
Thus, I moved on to the calibration part.
Calibration and data
Here was my data based on the distance between the two parts of the wood (which the capacitative sensors are attached to) and the serial plotter output in the y-axis. The closer the capacitative sensors are to each other, he greater the y-axis value.
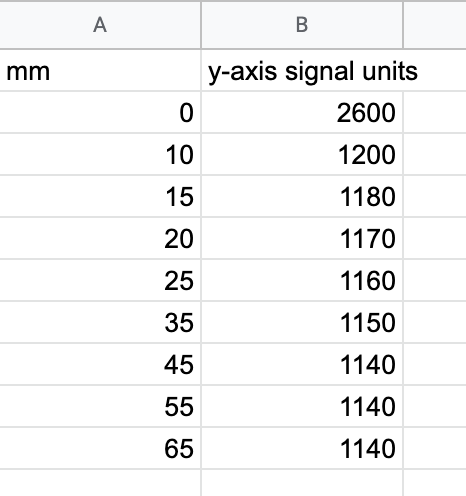
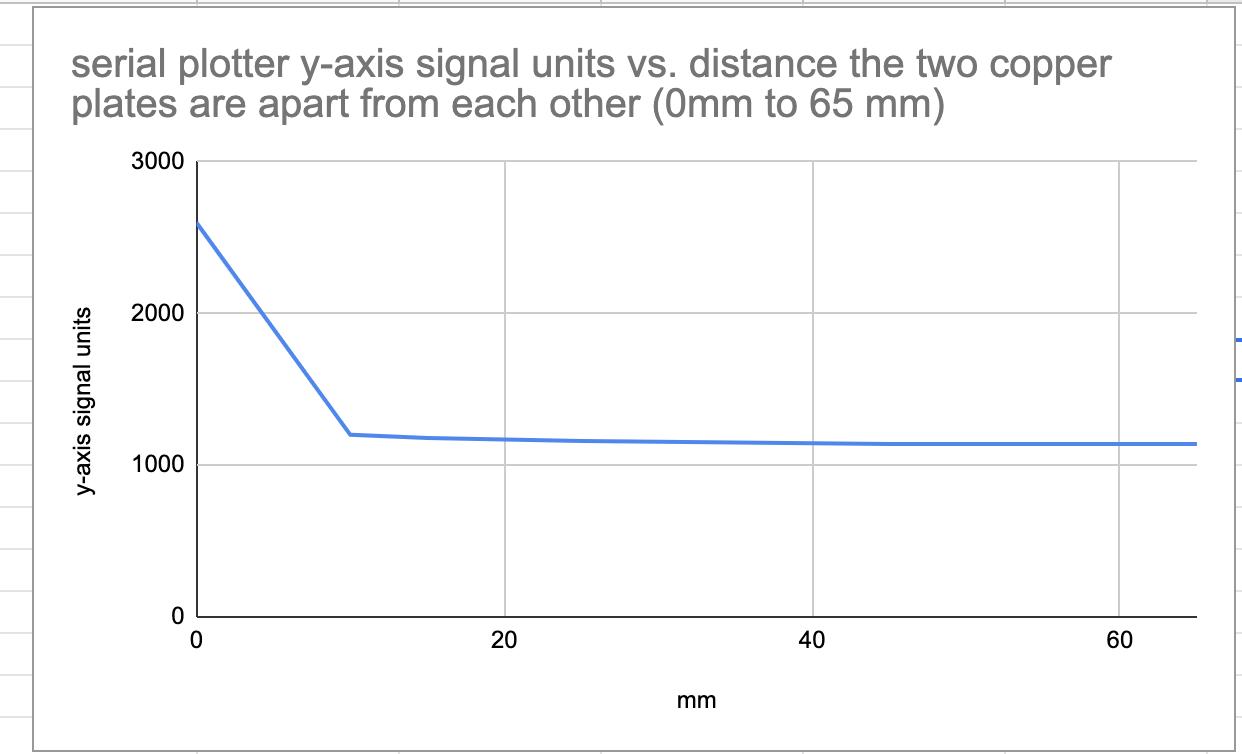
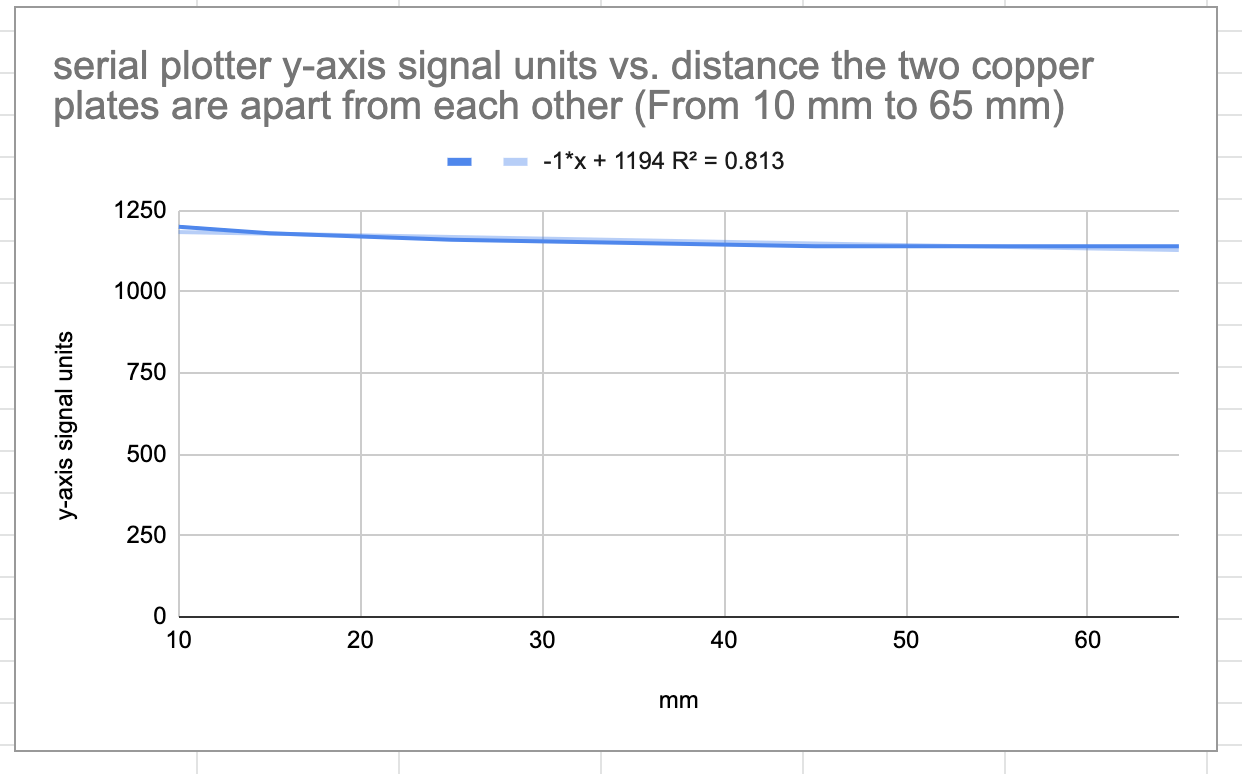
Plotting the data and examining the data closer, it seems like the signal is very strong when the two copper foils are touching each other. After this initial peak, as they are further apart, the signal on the y-axis decreases by around 10 units for every 10 mm it's moved apart. Then, once we get to 45 mm apart, the capacitative sensors are no longer in range to detect each other, and the signal is at a constant 1140 units.
Thus, 1140 is the baseline for "no signal," and each increase in 1 unit on the y axis corresponds to 1 mm (based on the equation of the line of best fit) of the capacitative sensor that's moved towards the capacitative sensor, followed by a large peak once it touches.
Reflections
It was super cool to work further with electronics. As someone with no electronics background and someone who hasn't worked with sensors, this was a very valuable experience! I'm hoping to use these skills in my final project and beyond. Especially since I see a lot of cool projects with sensors on YouTube (such as on the channels of Michael Reeves and Simone Giertz), I think I have the confidence to use these sensors in cool projects!